DeepAutoQSAR hardware benchmark

Executive Summary
- This benchmark evaluates the performance of DeepAutoQSAR on two datasets of different sizes using different hardware configurations and model training times.
- Our general recommendations, based on the results and the hardware costs, are to use the NVIDIA T4 GPU hardware with the following training times: 2 hrs for datasets with less than 1,000 data points; 4 hrs for 1,000 to 10,000 data points; and 8 hrs for more than 10,000 data points.
- While performance ultimately depends on the data, the intended purpose of this benchmark is to serve as a starting point for choosing the hardware to train the ML model(s) with and the specific model training time to use. Actual performance is highly dependent on the specific dataset and may require increasing the training time or choosing a different GPU to achieve the desired results.
Introduction
The application of machine learning (ML) to predict the molecular properties of drug candidates is an important area of research that has the potential to reduce drug development timelines and accelerate the creation of medicines for patients with serious unmet medical needs.
The successful application of ML relies on sufficient data quantity and quality, a suitable model architecture(s) for the given problem, proper hyperparameter choices (the parameters for a particular ML model architecture), and appropriate model training time for a chosen hardware configuration.
DeepAutoQSAR is a machine learning product that allows users to predict molecular properties based on chemical structure. The automated supervised learning pipeline enables both novice and experienced users to create and deploy best-in-class quantitative structure activity/property relationship (QSAR/QSPR) models.
The purpose of this benchmark, which builds on the work of an earlier whitepaper [1], is to characterize the performance of DeepAutoQSAR on two datasets of different sizes using different hardware configurations and model training times. While performance ultimately depends on the data, the intended purpose of this benchmark is to serve as a starting point for choosing the hardware to train the ML model(s) with and the specific model training time to use.
Datasets
The datasets used in the benchmark were obtained from the Therapeutics Data Commons (TDC). TDC provides ML-ready datasets that can be used for learning tasks that are valuable to pharmaceutical research and development and that cover different therapeutic modalities and stages of the drug development lifecycle [2].
We use two datasets that contain assay data for one Absorption, Distribution, Metabolism, and Excretion (ADME) property each:
- Caco2 (Human Epithelial Cell Effective Permeability)
- AqSolDB (Aqueous Solubility)
Performance is measured by the median accuracy of the ADME property prediction for a sample of train-test data splits; note that the specific train-test data splits used are different from the splits provided by TDC for its benchmark leaderboard.
Dataset Descriptions
Caco2 (Human Epithelial Cell Effective Permeability) [3]*
The human colon epithelial cancer cell line, Caco-2, is used as an in vitro model to simulate the human intestinal tissue. The experimental result on the rate of drug passing through the Caco-2 cells can approximate the rate at which the drug permeates through the human intestinal tissue.
This dataset contains numerical data for use in regression, and there are 906 compounds.
AqSolDB (Aqueous Solubility) [4]*
Aqueous solubility measures a drug’s ability to dissolve in water. Poor water solubility could lead to slow drug absorptions, inadequate bioavailability and even induce toxicity. More than 40% of new chemical entities are not soluble.
This dataset contains numeric, non-integer data for use in regression, and there are 9845 compounds.
*Note: The datasets have been modified from their original form to remove structural redundancies and experimental errors.
Hardware
The hardware used in the benchmark was provisioned from the Google Cloud Platform (GCP); therefore, the hardware configurations chosen were based on the machine types offered by Google.
These limitations on hardware configurations, dictated by the cloud provider, mean that only specific hardware pairings are available, such as a particular GPU platform that can only be used with a given CPU platform. For example, NVIDIA A100 GPUs can only be run on an A2 machine type, which only uses the Intel Cascade Lake CPU platform. Constrained by these limitations, every effort was made to keep hardware-specific options consistent across machine types, to provide hardware diversity when reasonable, and to use cost-effective high-performance computing hardware.
| Hardware Key | GCP Machine Type | CPU Platform | vCPUs* | RAM (GB) | GPU Platform | GPUs | Cost ($) per Hour+ |
|---|---|---|---|---|---|---|---|
| 2 vCPUs | n2-standard-2 | Intel Ice Lake | 2 | 8 | N/A | None | $0.10 |
| 4 vCPUs | n2-standard-4 | 4 | 16 | $0.19 | |||
| 8 vCPUs | n2-standard-8 | 8 | 32 | $0.39 | |||
| 16 vCPUs | n2-standard-16 | 16 | 64 | $0.78 | |||
| T4 GPU | n1-standard-4 | Intel Ice Lake** | 4 | 15 | Nvidia T4 | 1 | $0.54 |
| V100 GPU | Nvidia V100 | $2.67 | |||||
| A100 GPU | a2-highgpu-1g | Intel Cascade Lake | 12 | 85 | Nvidia A100 | $3.67 |
** Up to Intel Ice Lake generation; GCP auto assigns CPU platform on node pool creation.
+ Prices in November 2022. Includes sustained use discounts.
Benchmarking Methods & Results
Our benchmark is a two stage process. In the first stage, DeepAutoQSAR models are trained to fit the TDC datasets using a standard cross validation procedure to select top performing ML models for the model ensemble and to optimize hyperparameters; the end result of this stage is an ensemble of top performing models, which, under normal usage, are averaged to provide a mean prediction and associated ensemble standard deviation. We detail the specific protocol in our white paper, a Benchmark Study of DeepAutoQSAR, ChemProp, and DeepPurprose on the ADMET Subset of the Therapeutic Data Commons [1]. In the second stage, random train-test splits of the data are computed, and the previously determined ensemble of top ML models architectures with specific hyperparameter configurations are trained on the new training data splits. Predictions are then generated for the new test data splits. These multi-split metrics provide a more robust estimate of model performance by reducing potential bias introduced from a single train-test data split. Model performance in this hardware benchmark is reported as the median R2 coefficient of determination [5] across these random train-test splits for each hardware configuration and model training time.
In the first stage, the initial training procedure runs continuously for each training time allotment. Due to the stochastic nature of hyperparameter optimization and model architecture selection, each hardware and training time combination can potentially explore a different number of model architectures and hyperparameter combinations each time a benchmark job is run. The model training times evaluated were: 0.5, 1, 2, 4, 8, and 16 hours. As a general rule, more competent hardware running for longer training times on smaller datasets (e.g., a machine with an A100 GPU training for 16 hrs on the smaller Caco2 permeability dataset) will explore more hyperparameterizations than less competent hardware running for shorter training times on larger datasets (e.g., a two core machine training for 2 hrs on the larger AqSolDB dataset).
Since model architecture selection and hyperparameter sampling is a stochastic process, we run each benchmark configuration, which is the particular hardware and training time combination, three times and report averages for performance—this is especially relevant when fewer hyperparameter combinations are explored as model performance is more sensitive to hyperparameter sampling. The output of the first stage is an ensemble of top models, determined by cross validation, with specific hyperparameters choices for each.
The second stage of our benchmark runs for half the training time of the first stage. Increasing training time leads to more robust statistics as the median performance converges to a split-independent value, but comes at the expense of increased computational cost; in practice computational expense must be balanced with the need to train the ensemble model for a sufficiently large training time. For performance reporting we provide the median R2 coefficient of determination [5] as computed from the multiple train-test splits, which aims to reduce potential bias introduced by a single train-test split. To compute this R2, we repeatedly split the data into training and testing sets via bootstrap sampling with replacement; to do so, we take N samples with replacement from the dataset with N total data points and remove any duplicates to form a subset. The selected points are then used to train the specific model architectures found in stage one, and the unselected points serve as the test holdout. We do this until the time limit is reached and report the median R2 of all resamplings.
As both of the TDC datasets are numerical regression problems, this metric is a reasonable measure of model performance; however, the choice of performance metric in real-world applications should always be determined according to the use-case of the ensemble model. Sometimes MAE or RMSE are more appropriate to assess if a model is sufficiently performant. The output of the second stage is a distribution of ensemble model performances over different train-test splits; the reported value is the median of the distribution.
We plot the benchmark results, which is the median R2 coefficient of determination from the second stage, below. Our first plot shows performance on the AqSolDB dataset, and the second plot shows performance on the Caco2 permeability dataset. For each of these datasets, we highlight the progression of performance over time grouped by hardware type, where hardware type is on the x-axis, training time in hours is the bar color, and median R2 score is on the y-axis. The data used to generate the plots are provided in the supplementary tables.
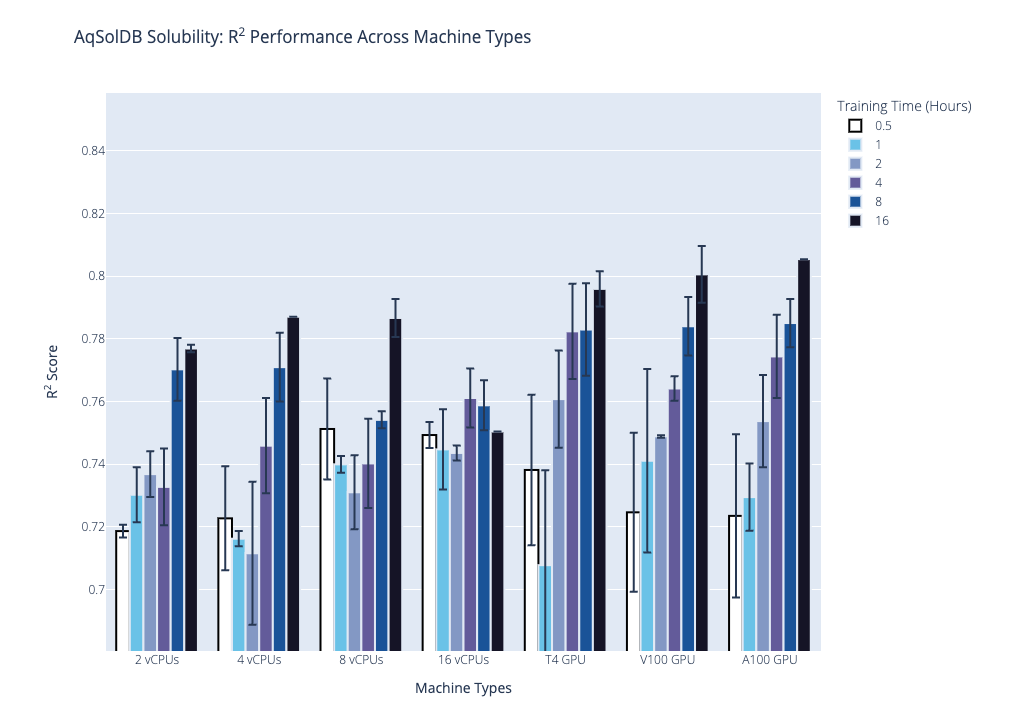
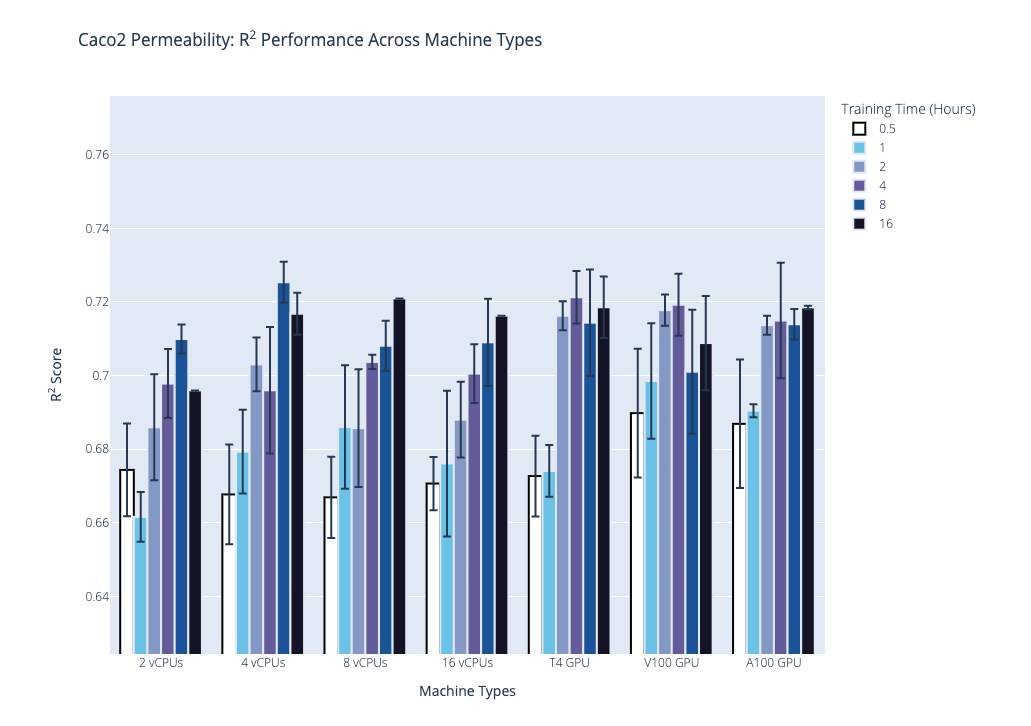
Based on these results and the hardware costs, our general recommendations are the following:
| Number of Data Points | Hardware | Training Time (hr) |
|---|---|---|
| <1,000 | Nvidia T4 GPU | 2 |
| 1,000 – 10,000 | 4 | |
| >10,000 | 8 |
Selected publications
-
Kaplan, Z.; Ehrlich, S.; Leswing, K. Benchmark study of DeepAutoQSAR, ChemProp, and DeepPurpose on the ADMET subset of the Therapeutic Data Commons. Schrödinger, Inc., 2022.
https://www.schrodinger.com/science-articles/benchmark-study-deepautoqsar-chemprop-and-deeppurpose-admet-subset-therapeutic-data (accessed 2022-11-29).
-
Therapeutics Data Commons.
https://tdcommons.ai/ (accessed 2022-06-15).
-
ADME – TDC.
https://tdcommons.ai/single_pred_tasks/adme/#caco-2-cell-effective-permeability-wang-et-al (accessed 2022-06-15).
-
ADME – TDC.
https://tdcommons.ai/single_pred_tasks/adme/#solubility-aqsoldb (accessed 2022-06-15).
-
Sklearn.metrics.r2_score — scikit-learn 1.1.3 documentation.
https://scikit-learn.org/stable/modules/generated/sklearn.metrics.r2_score.html#sklearn-metrics-r2-score (accessed 2022-11-29).
Software and services to meet your organizational needs
Industry-Leading Software Platform
Deploy digital drug discovery workflows using a comprehensive and user-friendly platform for molecular modeling, design, and collaboration.
Research Enablement Services
Leverage Schrödinger’s team of expert computational scientists to advance your projects through key stages in the drug discovery process.
Scientific and Technical Support
Access expert support, educational materials, and training resources designed for both novice and experienced users.